> ## Documentation Index
> Fetch the complete documentation index at: https://docs.agen.co/llms.txt
> Use this file to discover all available pages before exploring further.
# Telemetry
> Read what your AI agents actually do — event categories, verdicts, traces, and the filters that turn a fleet-wide feed into the evidence a policy rule is built from.
 Telemetry is the evidence layer — **AgenShield → Telemetry** in the
[Frontegg Portal](https://portal.frontegg.com)
(`https://portal.frontegg.com//agen/shielded/telemetry`). Every
governed agent on every enrolled Mac reports what it did and what AgenShield
decided, and that feed is what tells you which rules are worth writing.
This page is about **reading** telemetry. What is collected, what leaves the
device, and how secrets are stripped before anything is sent is covered in
[Privacy and data handling](../configuration/privacy-and-data.mdx).
## What an event is
Each row is one action an agent took, plus the decision made on it.
Telemetry is the evidence layer — **AgenShield → Telemetry** in the
[Frontegg Portal](https://portal.frontegg.com)
(`https://portal.frontegg.com//agen/shielded/telemetry`). Every
governed agent on every enrolled Mac reports what it did and what AgenShield
decided, and that feed is what tells you which rules are worth writing.
This page is about **reading** telemetry. What is collected, what leaves the
device, and how secrets are stripped before anything is sent is covered in
[Privacy and data handling](../configuration/privacy-and-data.mdx).
## What an event is
Each row is one action an agent took, plus the decision made on it.
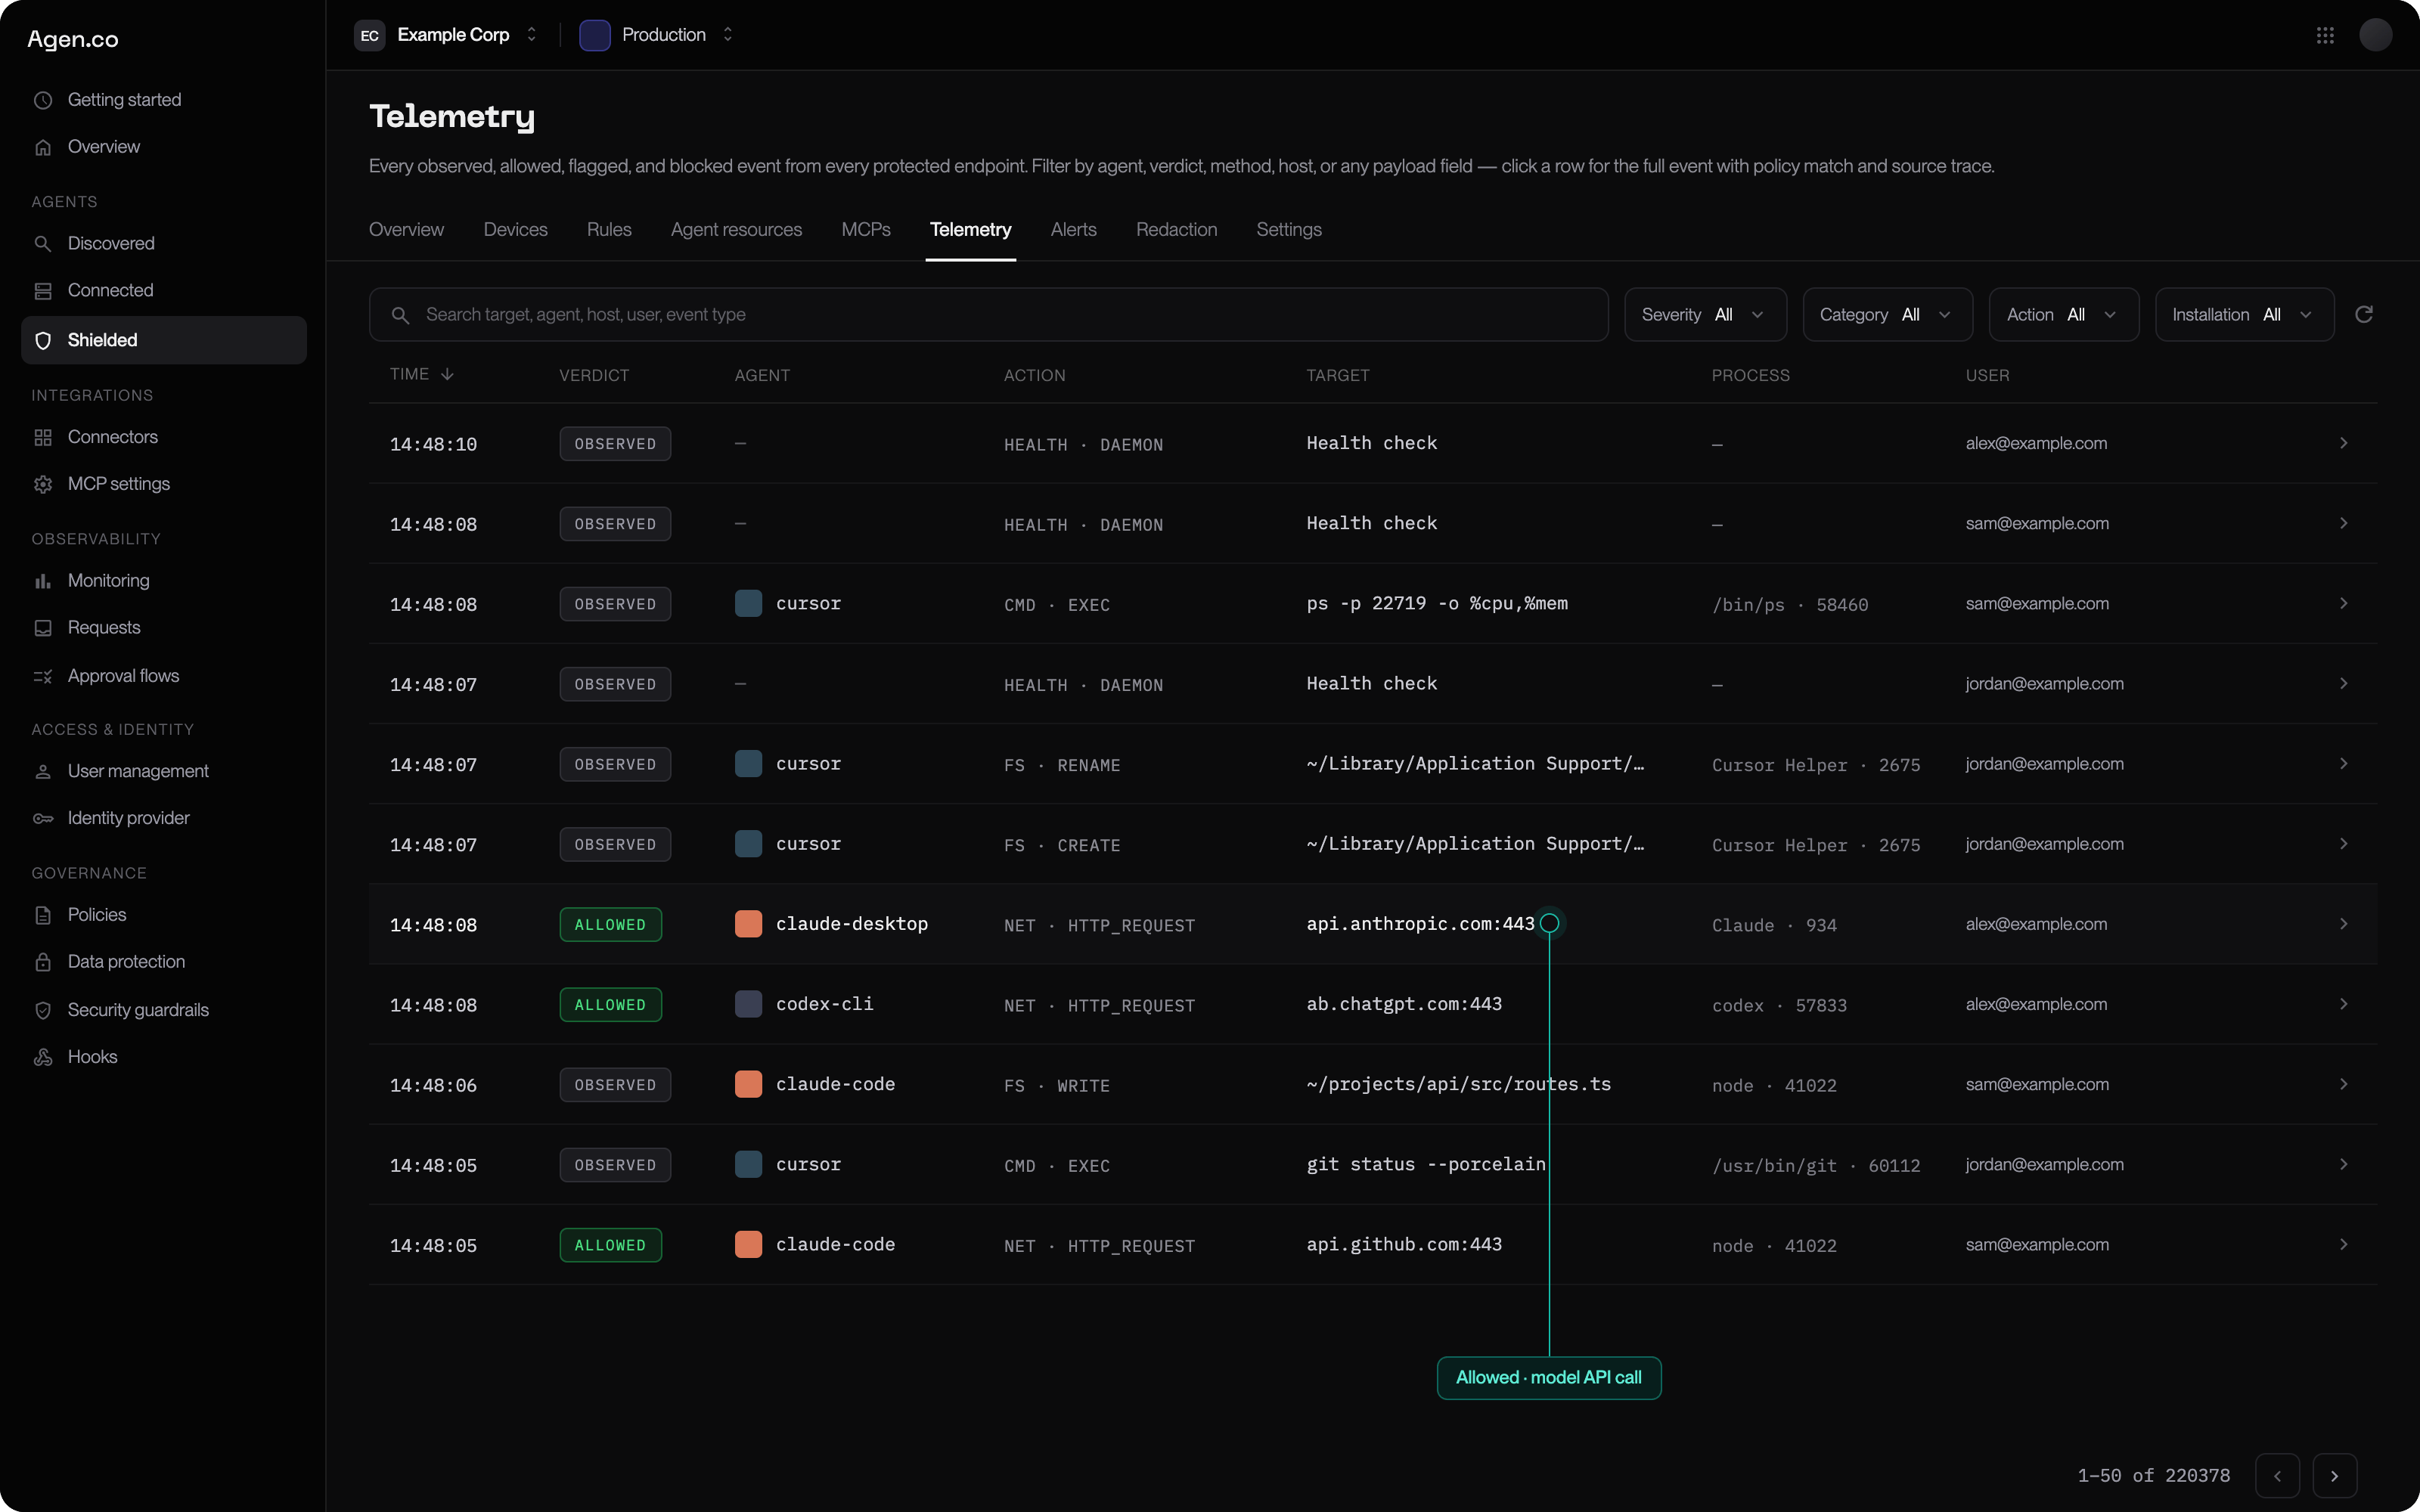 | Column | What it tells you |
| ----------- | ----------------------------------------------------------------- |
| **Time** | When it happened |
| **Verdict** | What AgenShield decided |
| **Action** | What was attempted |
| **Target** | The command, path, or destination involved |
| **Agent** | Which AI agent was responsible |
| **Process** | The specific process that acted — often a tool the agent launched |
| **User** | The account it ran under |
Repeated identical events are **coalesced** into one row with an occurrence
count, so a build loop does not bury everything else.
## Verdicts
| Verdict | Means |
| ------------ | ------------------------------------------------------------- |
| **Observed** | Recorded, no rule matched |
| **Allowed** | A rule permitted it |
| **Denied** | A rule blocked it |
| **Killed** | The action triggered a rule severe enough to stop the process |
In monitor mode you will see **Observed** and **Allowed** only — a rule that
would have blocked still records what it would have done, which is precisely the
signal you promote a rule on.
## Categories
Filter by category to answer one question at a time:
| Category | Answers |
| ------------------- | ------------------------------------------------------------- |
| **Commands** | What are agents executing? |
| **Filesystem** | What are they reading and writing — and how close to secrets? |
| **Network** | Which destinations do they need? |
| **Process** | What are they launching, and what does that launch in turn? |
| **Agent resources** | Which skills, connectors, and extensions are being loaded? |
| **Auth** | Credential and session activity |
| **Security** | Things that warrant attention on their own |
| **Health** | Device and agent state, not agent behaviour |
Severity — **Info**, **Warning**, **Critical** — cuts across all of them.
## Traces
Event counts tell you *how often*. A **trace** tells you *why*, and it is almost
always the faster tool.
Click any row to open the full event: the rule that matched, and the chain that
produced the action — the root agent, the tool it launched, the file that tool
read, the request it made, and the decision at each step.
| Column | What it tells you |
| ----------- | ----------------------------------------------------------------- |
| **Time** | When it happened |
| **Verdict** | What AgenShield decided |
| **Action** | What was attempted |
| **Target** | The command, path, or destination involved |
| **Agent** | Which AI agent was responsible |
| **Process** | The specific process that acted — often a tool the agent launched |
| **User** | The account it ran under |
Repeated identical events are **coalesced** into one row with an occurrence
count, so a build loop does not bury everything else.
## Verdicts
| Verdict | Means |
| ------------ | ------------------------------------------------------------- |
| **Observed** | Recorded, no rule matched |
| **Allowed** | A rule permitted it |
| **Denied** | A rule blocked it |
| **Killed** | The action triggered a rule severe enough to stop the process |
In monitor mode you will see **Observed** and **Allowed** only — a rule that
would have blocked still records what it would have done, which is precisely the
signal you promote a rule on.
## Categories
Filter by category to answer one question at a time:
| Category | Answers |
| ------------------- | ------------------------------------------------------------- |
| **Commands** | What are agents executing? |
| **Filesystem** | What are they reading and writing — and how close to secrets? |
| **Network** | Which destinations do they need? |
| **Process** | What are they launching, and what does that launch in turn? |
| **Agent resources** | Which skills, connectors, and extensions are being loaded? |
| **Auth** | Credential and session activity |
| **Security** | Things that warrant attention on their own |
| **Health** | Device and agent state, not agent behaviour |
Severity — **Info**, **Warning**, **Critical** — cuts across all of them.
## Traces
Event counts tell you *how often*. A **trace** tells you *why*, and it is almost
always the faster tool.
Click any row to open the full event: the rule that matched, and the chain that
produced the action — the root agent, the tool it launched, the file that tool
read, the request it made, and the decision at each step.
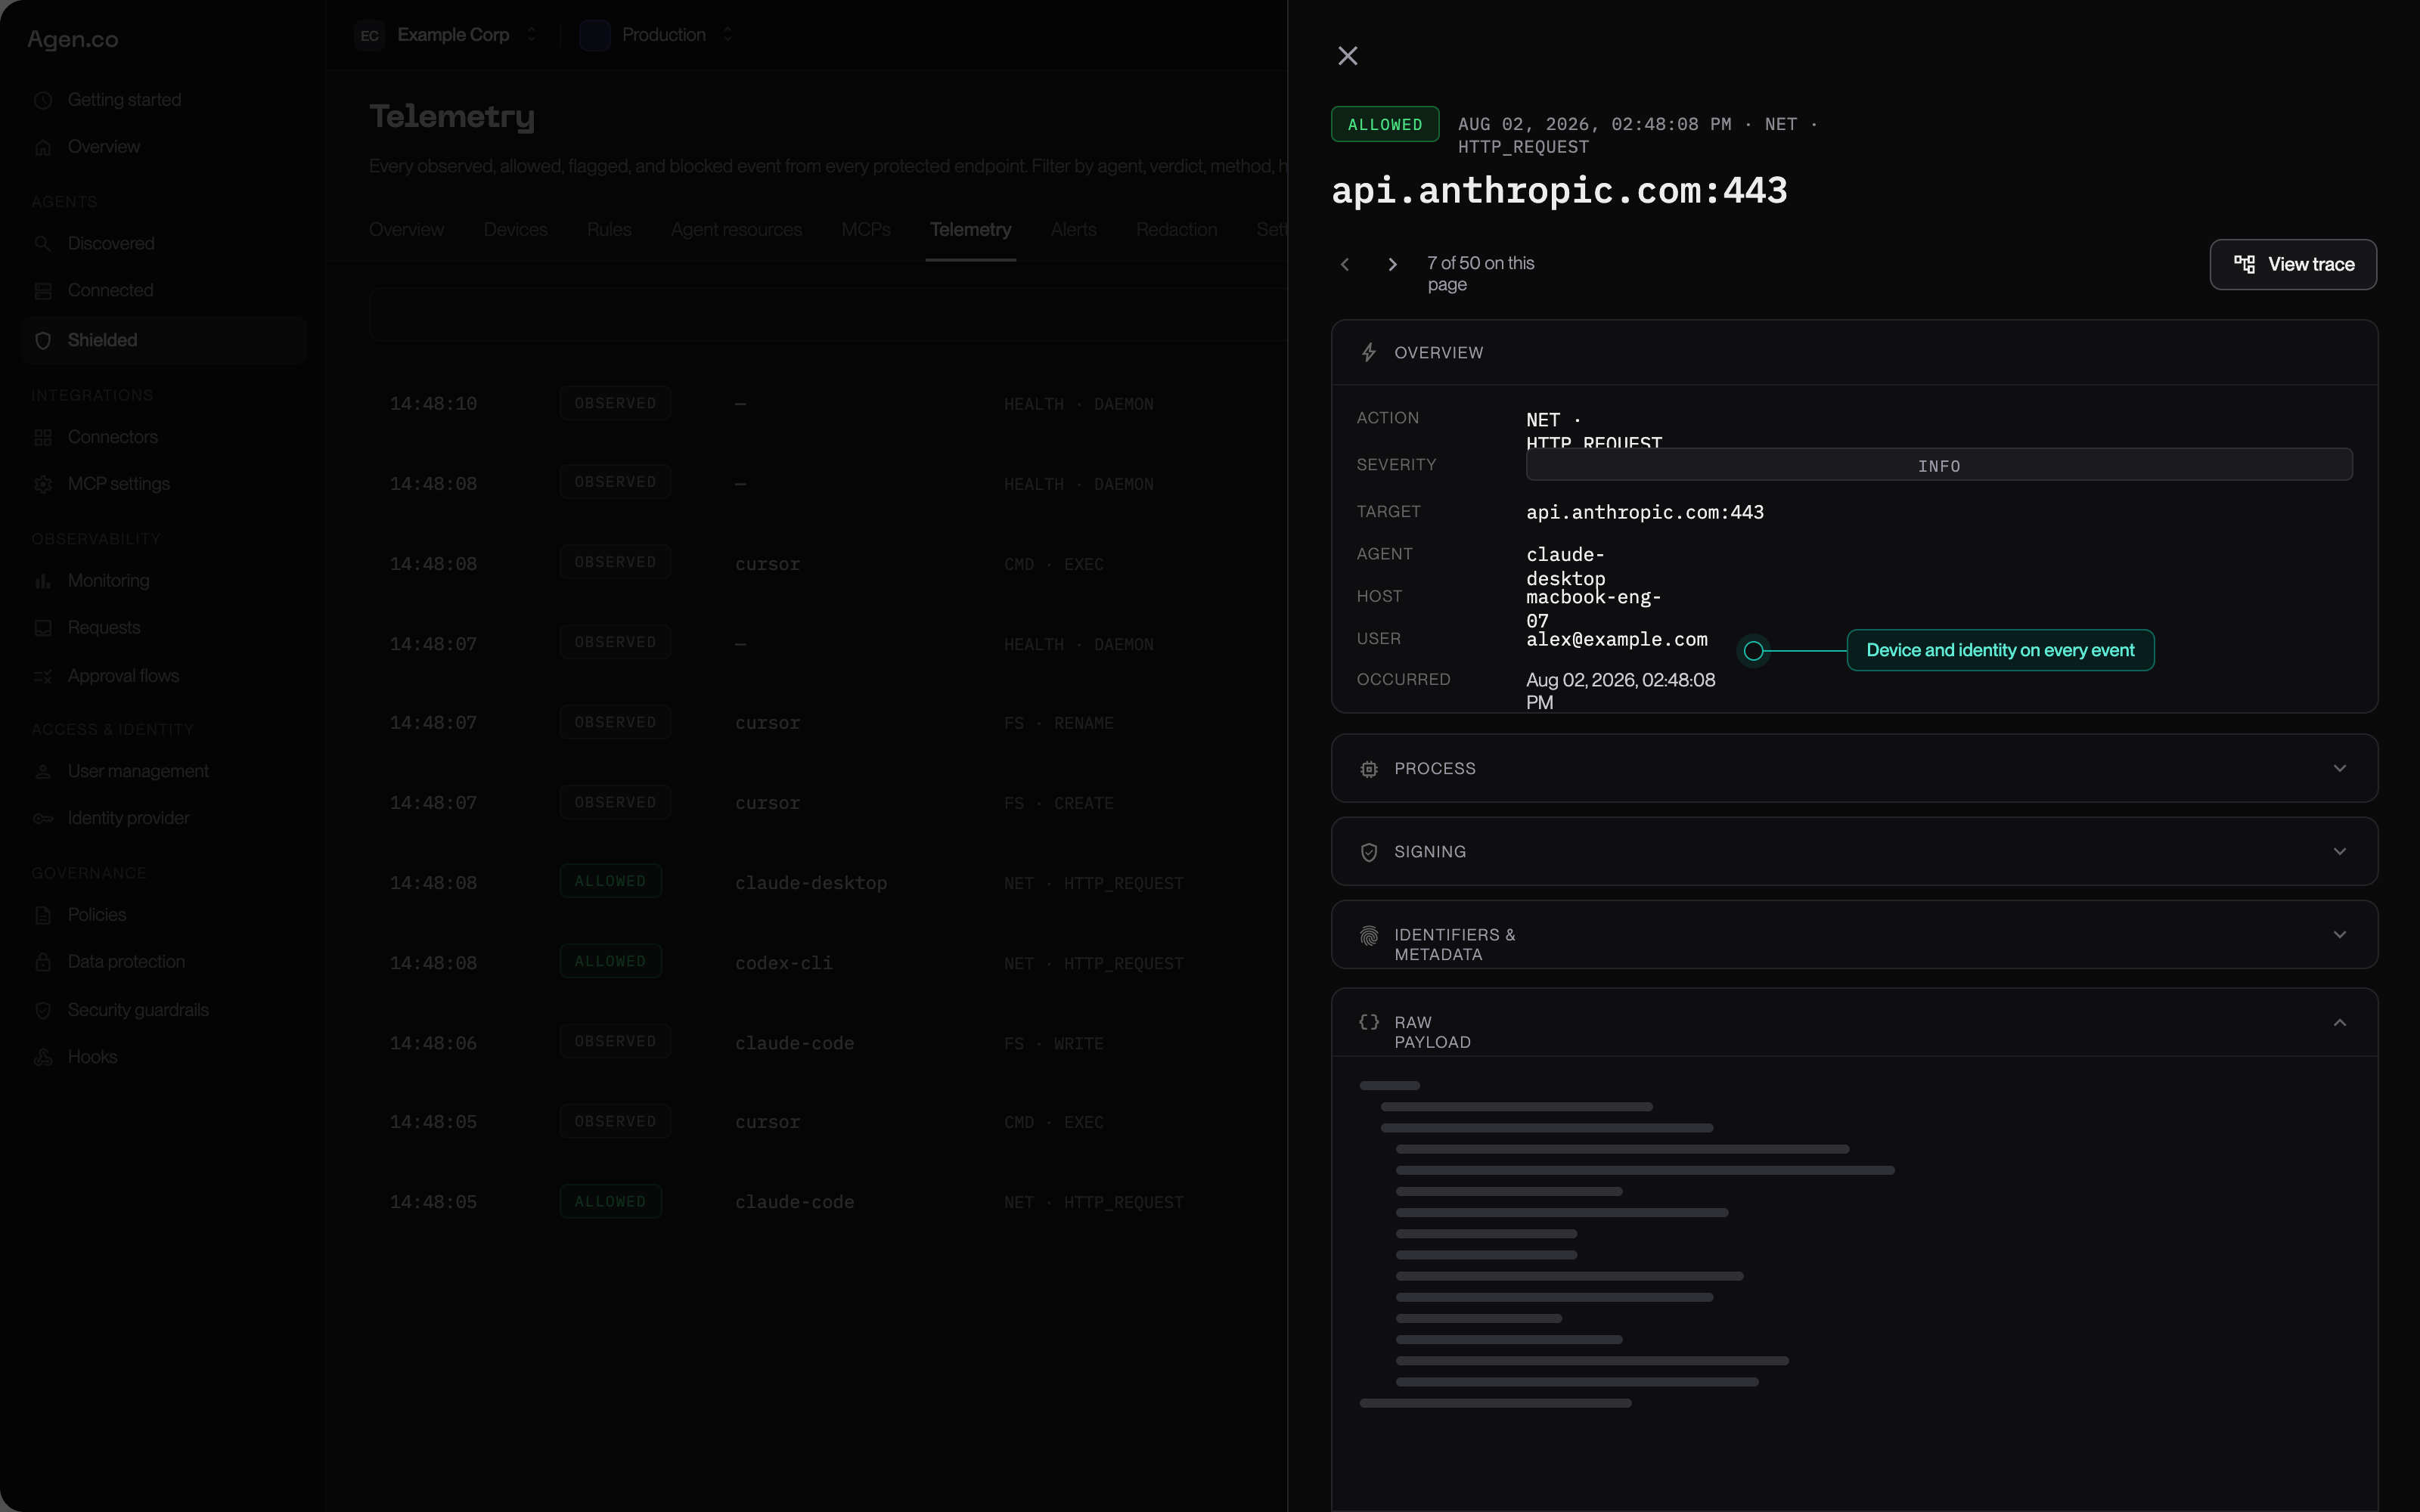 One trace usually settles "is this legitimate?" at a glance, where a thousand
event counts do not. When you are deciding whether to write a rule, open two or
three traces rather than scanning the table.
## Turning the feed into rules
The workflow that produces good policy:
Fleet-wide is noise. One agent at a time is a pattern.
"Which hosts does Claude Code need?" is answerable. "What is happening?" is not.
Confirm the chain before you decide anything.
Scoped to that agent, that path, that operation. See [Rules and policy](../configuration/policies.mdx).
Check that it matches what you expected and nothing else, then pin it to enforce.
Auto-refresh keeps the feed live while you work; pause it when you are reading
carefully, or the rows will move under you.
## Controlling how much is collected
**Settings → Telemetry.** Two independent controls:
| Control | What it does |
| ---------------------- | ------------------------------------------------------------------------------------------------------------------------------------------- |
| **Telemetry filters** | Which event categories are reported at all. Drop what you will never act on |
| **Visibility profile** | How much detail each event carries. Keeps the signal — "this agent read a credentials file" — while dropping literal paths and destinations |
A visibility profile is the setting to reach for when a privacy or works-council
review asks for data minimisation: you keep the security signal and give up the
specifics. **Redaction** is separate and always on — anything that looks like a
credential is stripped on the device before transmission, regardless of these
settings.
Filtering out a category also removes it from the evidence you would use to
write rules later. During a monitor-mode rollout, collect broadly; narrow once
you know what you actually act on.
## Alerts
Rules that matter should not depend on someone watching a feed. **Alerts** turn
a telemetry pattern into a notification, so a credential-file read or a
connection to an unapproved destination reaches a person without anyone
scrolling.
## Next
Turn what you have seen into narrowly scoped rules.
The skills and connectors behind a lot of what you will see here.
What is recorded, what leaves the device, and what it never sees.
How long to watch before you start blocking.
One trace usually settles "is this legitimate?" at a glance, where a thousand
event counts do not. When you are deciding whether to write a rule, open two or
three traces rather than scanning the table.
## Turning the feed into rules
The workflow that produces good policy:
Fleet-wide is noise. One agent at a time is a pattern.
"Which hosts does Claude Code need?" is answerable. "What is happening?" is not.
Confirm the chain before you decide anything.
Scoped to that agent, that path, that operation. See [Rules and policy](../configuration/policies.mdx).
Check that it matches what you expected and nothing else, then pin it to enforce.
Auto-refresh keeps the feed live while you work; pause it when you are reading
carefully, or the rows will move under you.
## Controlling how much is collected
**Settings → Telemetry.** Two independent controls:
| Control | What it does |
| ---------------------- | ------------------------------------------------------------------------------------------------------------------------------------------- |
| **Telemetry filters** | Which event categories are reported at all. Drop what you will never act on |
| **Visibility profile** | How much detail each event carries. Keeps the signal — "this agent read a credentials file" — while dropping literal paths and destinations |
A visibility profile is the setting to reach for when a privacy or works-council
review asks for data minimisation: you keep the security signal and give up the
specifics. **Redaction** is separate and always on — anything that looks like a
credential is stripped on the device before transmission, regardless of these
settings.
Filtering out a category also removes it from the evidence you would use to
write rules later. During a monitor-mode rollout, collect broadly; narrow once
you know what you actually act on.
## Alerts
Rules that matter should not depend on someone watching a feed. **Alerts** turn
a telemetry pattern into a notification, so a credential-file read or a
connection to an unapproved destination reaches a person without anyone
scrolling.
## Next
Turn what you have seen into narrowly scoped rules.
The skills and connectors behind a lot of what you will see here.
What is recorded, what leaves the device, and what it never sees.
How long to watch before you start blocking.