
 Telemetry is the evidence layer — AgenShield → Telemetry in the
Frontegg Portal
(
Telemetry is the evidence layer — AgenShield → Telemetry in the
Frontegg Portal
(https://portal.frontegg.com/<environment>/agen/shielded/telemetry). Every
governed agent on every enrolled Mac reports what it did and what AgenShield
decided, and that feed is what tells you which rules are worth writing.
This page is about reading telemetry. What is collected, what leaves the
device, and how secrets are stripped before anything is sent is covered in
Privacy and data handling.
What an event is
Each row is one action an agent took, plus the decision made on it.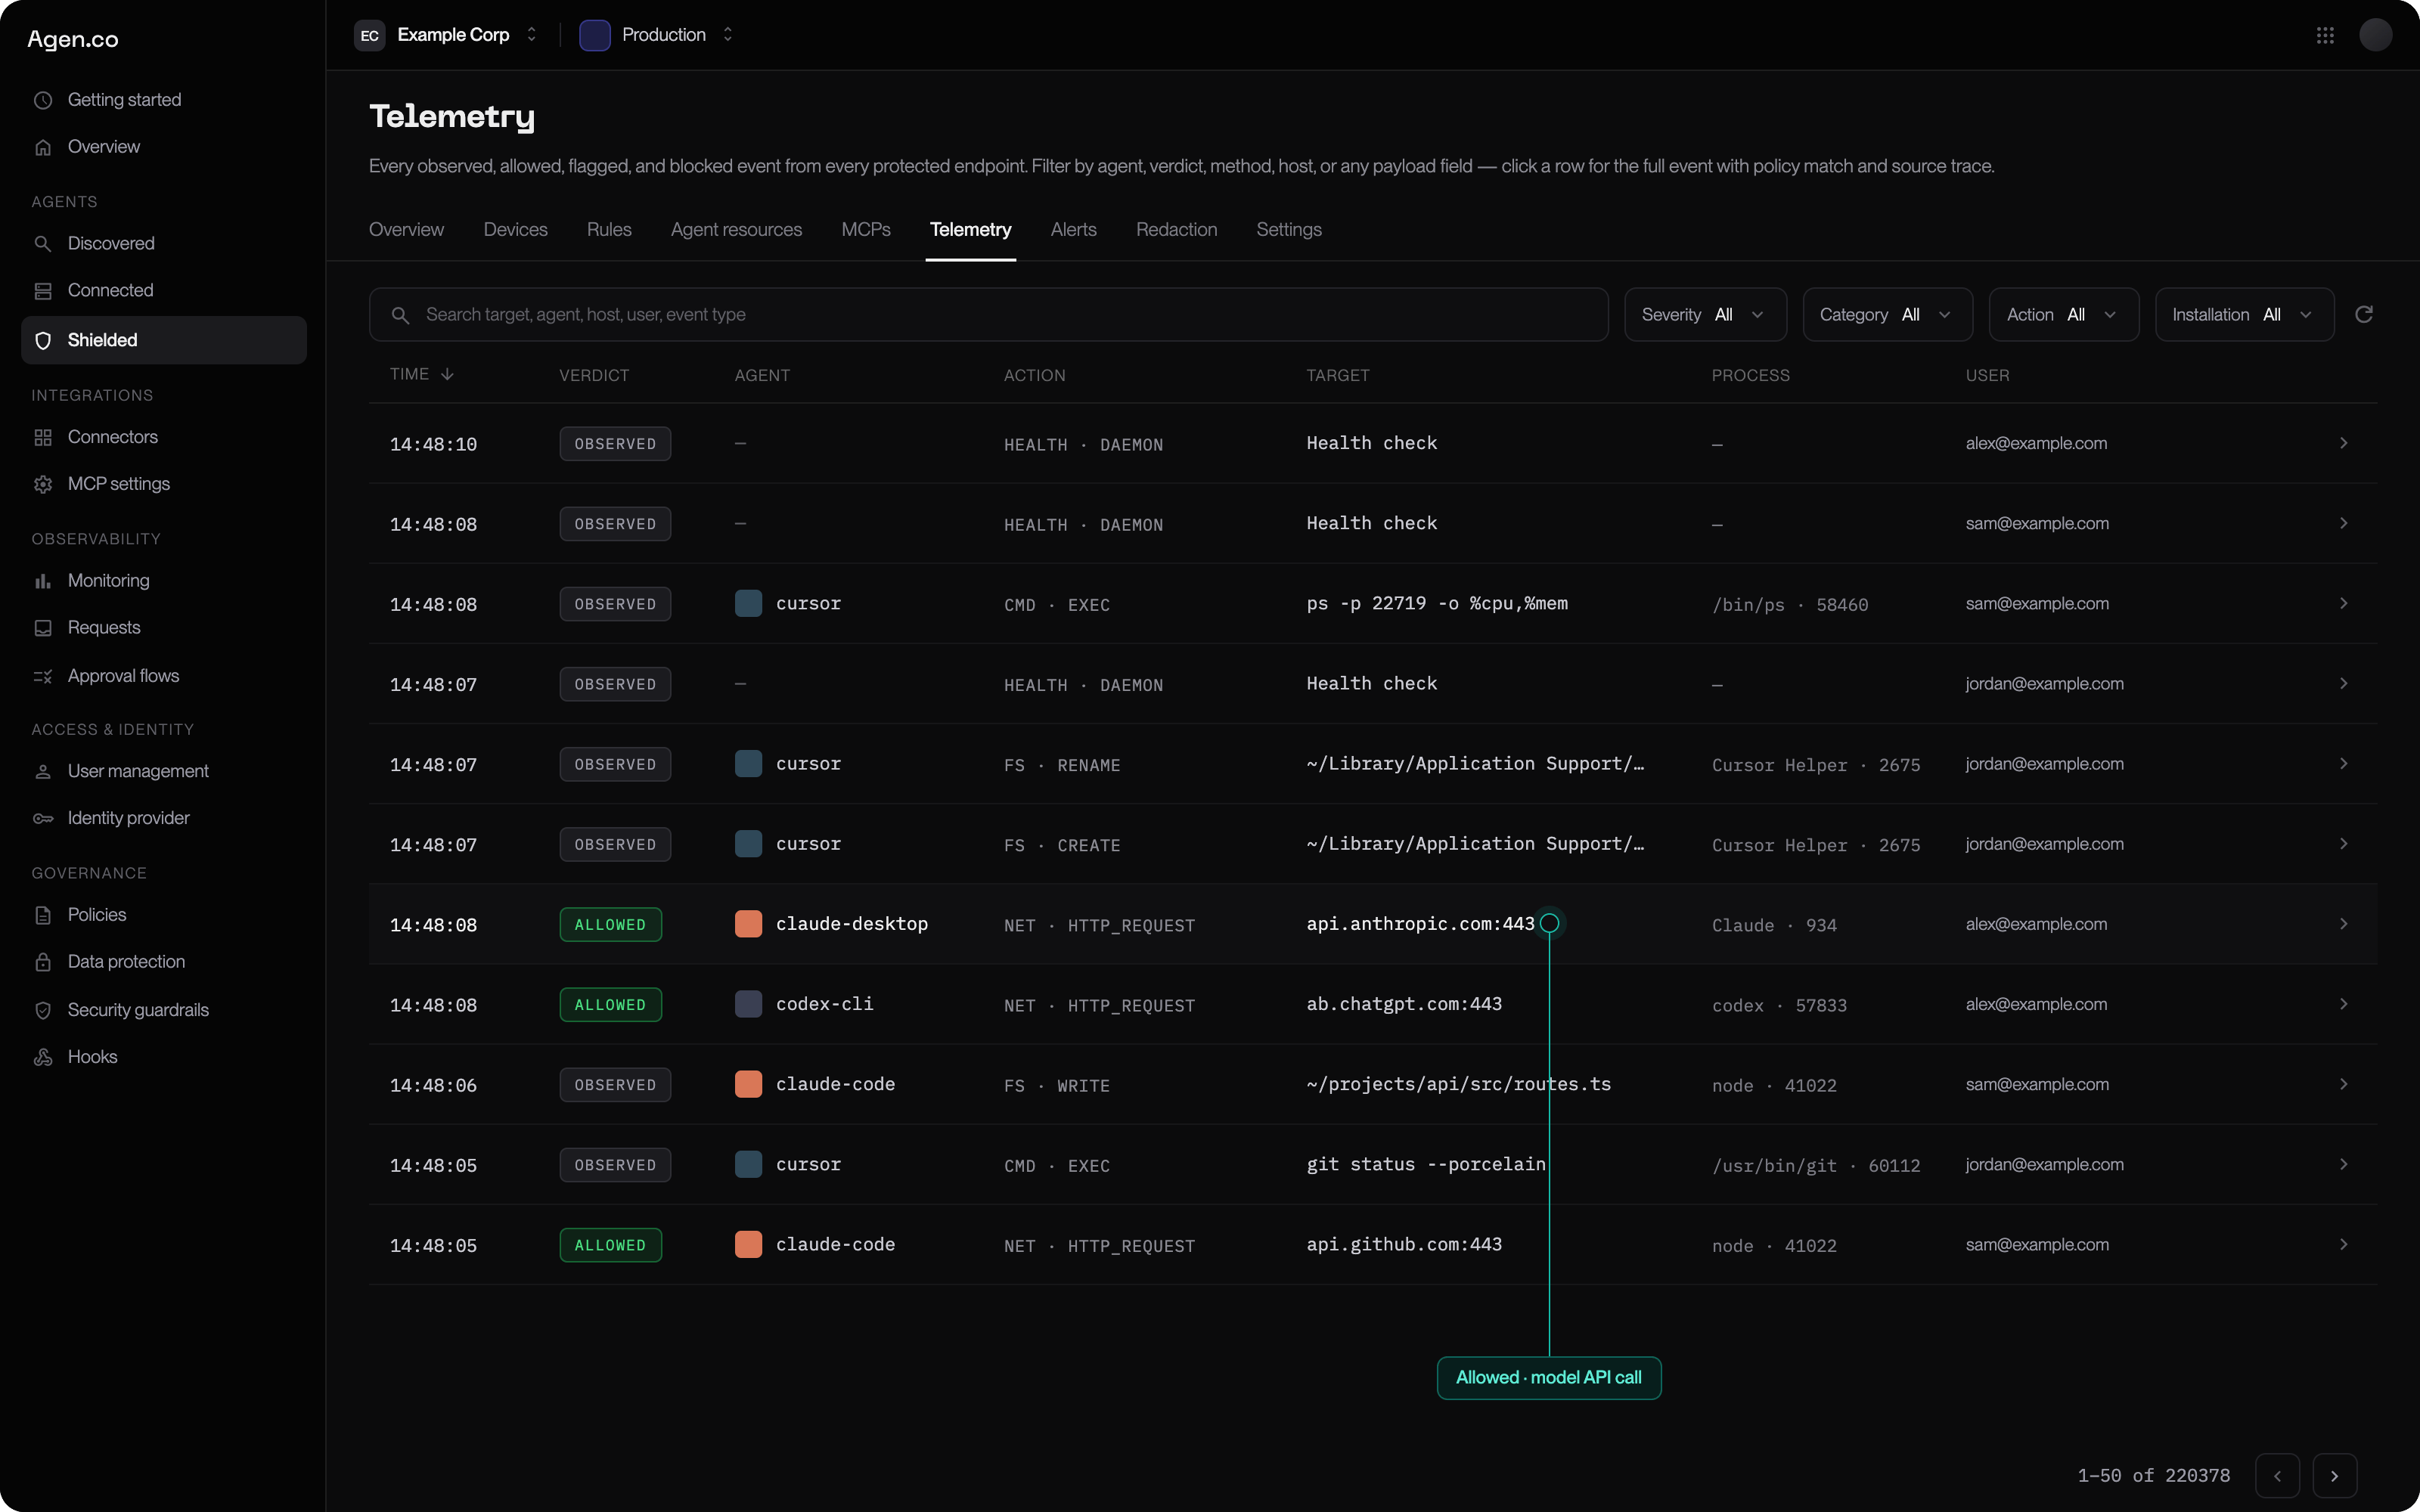
The telemetry feed — one row per action, with the verdict on each.
Repeated identical events are coalesced into one row with an occurrence
count, so a build loop does not bury everything else.
Verdicts
In monitor mode you will see Observed and Allowed only — a rule that
would have blocked still records what it would have done, which is precisely the
signal you promote a rule on.
Categories
Filter by category to answer one question at a time:
Severity — Info, Warning, Critical — cuts across all of them.
Traces
Event counts tell you how often. A trace tells you why, and it is almost always the faster tool. Click any row to open the full event: the rule that matched, and the chain that produced the action — the root agent, the tool it launched, the file that tool read, the request it made, and the decision at each step.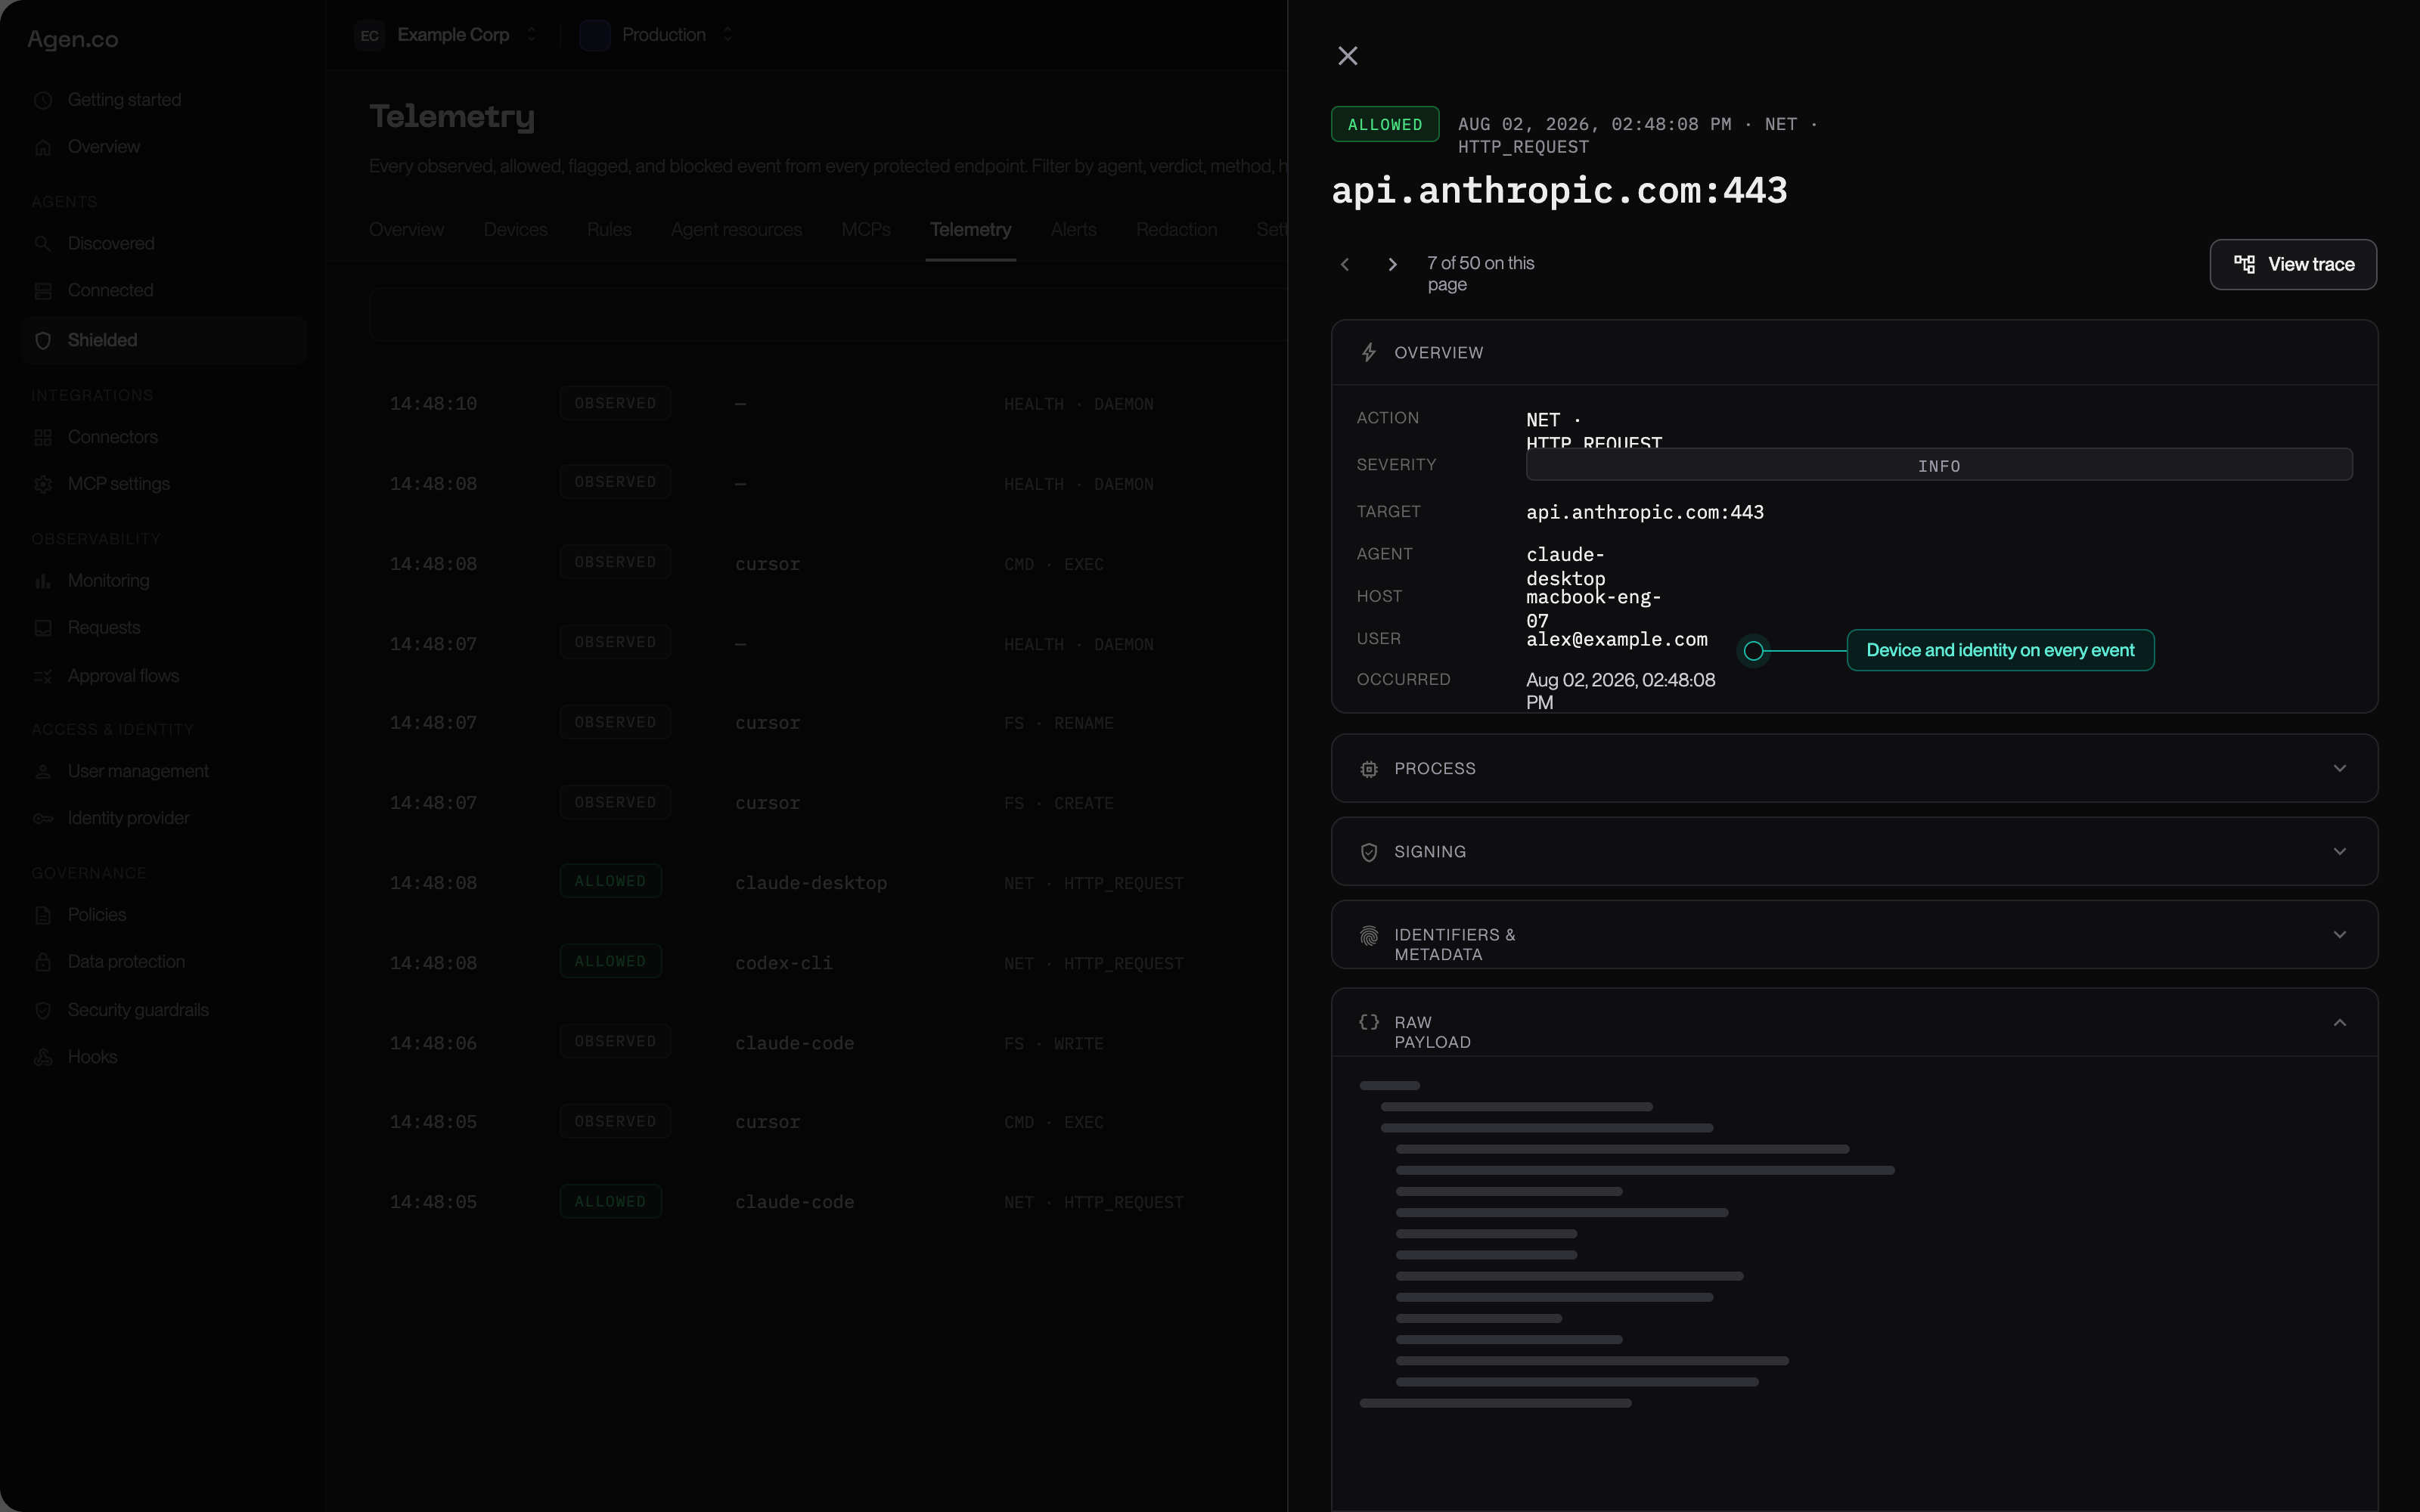
An event opened — the destination, the agent, the device, and the user, with the trace one click away.
Turning the feed into rules
The workflow that produces good policy:1
Filter to one agent
Fleet-wide is noise. One agent at a time is a pattern.
2
Filter to one category
“Which hosts does Claude Code need?” is answerable. “What is happening?” is not.
3
Open traces, not rows
Confirm the chain before you decide anything.
4
Write the narrowest rule that covers it
Scoped to that agent, that path, that operation. See Rules and policy.
5
Leave it in monitor and come back
Check that it matches what you expected and nothing else, then pin it to enforce.
Controlling how much is collected
Settings → Telemetry. Two independent controls:
A visibility profile is the setting to reach for when a privacy or works-council
review asks for data minimisation: you keep the security signal and give up the
specifics. Redaction is separate and always on — anything that looks like a
credential is stripped on the device before transmission, regardless of these
settings.
Alerts
Rules that matter should not depend on someone watching a feed. Alerts turn a telemetry pattern into a notification, so a credential-file read or a connection to an unapproved destination reaches a person without anyone scrolling.Next
Rules and policy
Turn what you have seen into narrowly scoped rules.
Agent resources
The skills and connectors behind a lot of what you will see here.
Privacy and data handling
What is recorded, what leaves the device, and what it never sees.
Rollout playbook
How long to watch before you start blocking.